Data Science Weekly - Issue 638Curated news, articles and jobs related to Data Science, AI, & Machine Learning
Issue #638 |

 |
The bottleneck isn’t access to information - it’s synthesis. Thirty tabs, a dozen reports, scattered spreadsheets, a handful of half-read articles, and all of it needs to become a deliverable by Friday.
Otio.ai is a research workspace where everything lives in one place - upload directly or connect your Google Drive. Unlimited storage, no file juggling.
Drop in a CSV and start making sense of your data. Otio analyses it, generates visualisations, and lets you chat across it, alongside every other source - using any AI model (Claude, GPT, Gemini, DeepSeek, Grok). Switch models without re-uploading and find every answer source-grounded with verifiable citations.
Finally, turn answers into exportable deliverables - reports, presentations, documents - directly from your material. 200,000+ researchers, analysts, and consultants use Otio to go from raw data to finished work.
Try Otio free - chat with your data, visualise it, deliver it.
.
And now…let’s dive into some interesting links from this week.
Editor's Picks
Do predictive models need to be causal?
Do predictive models need to be causal? At first glance the response is something like “Of course not; are you high?”…If you have a model logP(Y=1)=α+βXX+βZZ then whether the model is usefully predictive has almost nothing to do with whether one of βX and βZ can be interpreted as the effect of its predictor on Y…However, the model being usefully predictive does rely on βX and βZ being (approximately) the same in production use as they are in the training set. What does it take to warrant a belief that they will be the same? Prediction is hard, as the Danish proverb says, especially when it comes to the future…
Trying out dplyr 1.2.0
Last week Posit released a new version of {dplyr}, the powerhouse of {tidyverse}. This new release brought big changes to two heavily used processes, filtering and recoding. In this blog post I review some of these changes, and then attempt to try out these changes by replacing some of my old data wrangling code with the new functions…Edgeworth Proposed the .005 Criterion Back in 1885
The statistical significance test was not invented by Ronald Fisher. The key idea was already laid out by Francis Ysidro Edgeworth (1845-1926), whose 1885 article “Methods of statistics” is quite explicit about the purpose, design, and interpretation of the significance test. As summarized by Kennedy-Shaffer…
What’s on your mind
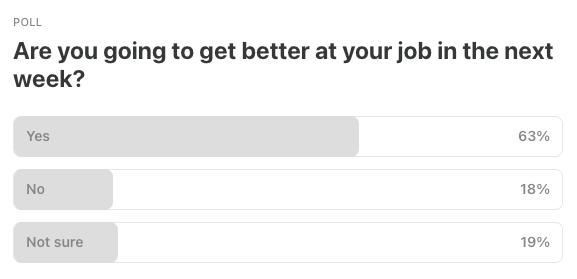
This Week’s Poll:
|
.
Last Week’s Poll:
 |
.
Data Science Articles & Videos
Text classification with Python 3.14’s zstd module
Python 3.14 introduced the compression.zstd module. It is a standard library implementation of Facebook’s Zstandard (Zstd) compression algorithm…Zstd caught my eye because it supports incremental compression. You can feed it data to compress in chunks, and it will maintain an internal state. It’s particularly well suited for compressing small data…Before delving into the machine learning part, I’ll provide a snippet to build some intuition. The main class we’re interested in is ZstdCompressor. It has a compress method that takes a chunk of data and returns the compressed output. The data it compresses is then added to its internal state…Is Gen AI the only way forward? [Reddit]
I just had 3 shitty interviews back-to-back. Primarily because there was an insane mismatch between their requirements and my skillset. I am your standard Data Scientist (Banking, FMCG and Supply Chain), with analytics heavy experience along with some ML model development…I am looking for new jobs but all I get calls are for Gen AI. But their JD mentions other stuff - Relational DBs, Cloud, Standard ML toolkit...you get it. So, I had assumed GenAI would not be the primary requirement, but something like good-to-have. But upon facing the interview, it turns out, these are GenAI developer roles that require heavily technical and training of LLM models…
When lookout sees crackle: Anomaly detection via kernel density estimation
We present an updated version of lookout — an algorithm for detecting anomalies using kernel density estimates with bandwidth based on Rips death diameters — with theoretical guarantees. The kernel density estimator for updated lookout is shown to be consistent, and the proposed multivariate scaling is robust and efficient. We show our updated algorithm performs better than the previous version on diverse examples…Heuristics for [biology] lab robotics, and where its future may go
To understand lab robotics, you need to understand what actually happens in a lab—the literal physical movements and the way the instruments are handled and how materials are stored and everything else—and I do not actually understand what happens in a lab…This essay is my attempt to fix this, and to provide to you an explanation of the heuristics I have gained from talking to many people in this space. It isn’t comprehensive! But it does cover at least some of the dominant strains of thought I see roaming around in the domain experts of the world…Creating actually publication-ready figures for journals using ggplot2
If you’ve ever used ggplot2 to create figures for a journal article, you’ve probably experienced this: your plot looks perfect in RStudio, but when you save it at the required dimensions (e.g. relative to an A4 page), the proportions look completely off…This guide walks through my workflow for creating figures that are actually publication-ready, without writing custom code for every plot or endlessly fiddling with parameters. The goal is to spend less time adjusting figures…Bringing Students, Researchers, and Industry Together with R in Malaysia
Richie Yu Yong Poh, organizer of the Malaysia R User Group, recently spoke with the R Consortium about building a national R community centered around its annual conference…Is Your “Human-in-the-Loop” Actually Slowing You Down? Here’s What We Learned
In this post, we’ll analyze when human-in-the-loop is truly valuable, when it slows systems down, and how to strike the right balance between automation and human judgment…How we made geo joins 400× faster with H3 indexes
Geo joins look innocent:SELECT * FROM A JOIN B ON ST_Intersects(A.geo, B.geo);but at scale they can become the query that ruins your day…Geospatial functions are expensive, and they often force a loop join that starts to feel quadratic as your tables grow…The core idea in this post is simple: we’ll see how Floe automatically rewrites this kind of query and takes advantage of H3 indexes for dramatic speedup…
Analysis of Mastermind-like bottle match game
During the holidays, my niece introduced me to a “bottle match” game, variants of which have apparently made the rounds online for a while now, but it was new to me. She secretly arranges seven wooden bottle-shaped pegs, each of a different color, in a row. I then make a series of guesses of the ordering of the colors (arranging a second set of seven bottles visible to everyone), with each guess scored with a number indicating how many bottles are in the correct position. The objective is to get all seven bottles in the correct order in as few guesses as possible…
How to Do Agentic Data Science
In this blog post, I share ten lessons I’ve learned from experimenting with agentic coding in data science, from setting clear goals and structuring projects to leveraging coding agents for faster iterations and better insights. I discuss practical tips like maintaining logs, generating diagnostic plots, and treating the agent as a partner in exploration…Statistical testing in null worlds: Learn the intuition behind p-values through simulation
At their core, all statistical tests can be conducted by following a universal pattern:
Step 1: Calculate a sample statistic, or (“delta”)
Step 2: Use simulation to invent a world where is null
Step 3: Look at in the null world
Step 4: Calculate the probability that could exist in the null world
Step 5: Decide if is statistically significant
That’s all. Five steps. No need to follow complicated flowcharts to select the best and most appropriate statistical test. No need to decide which pretests you need to run to choose the right flavor of t-test. No need to think about whether you should use a t- or a z- distribution for your test statistic…Simulate instead…
Looking for a more rigorous understanding of degrees of freedom [Reddit]
I’m sort of fed up with the hand-wavy explanation I continue to get regarding degrees of freedom. I have taken a number of stats courses during my time in school(undergrad and graduate level) and I always receive this very surface level explanation and i kind of hate it. Like i can follow along explanations just fine, it’s not that im dumbfounded when they come up, but id like to actually understand this concept. If anyone has any good resources i’d appreciate it, im looking for a mix of mathematical rigor with intuition. Emphasis on the former, any help is greatly appreciate, thanks…There is only one test!
One of the most commons question I see is something like, “I have some data. Which test should I use?” When I see this question, I always have two thoughts:1) I hate the way statistics is taught, because it gives students the impression that hypothesis testing is all about choosing the right test, and if you get it wrong the statistics wonks will yell at you, and
2) There is only one test!
Let me explain. All tests try to answer the same question: “Is the apparent effect real, or is it due to chance?” To answer that question, we formulate two hypotheses: the null hypothesis, H0, is a model of the system if the effect is due to chance; the alternate hypothesis, HA, is a model where the effect is real…
.
Last Week's Newsletter's 3 Most Clicked Links
Points, Rules, Weights, Distributions: The Elements of Machine Learning
Accelerating Scientific Research with Gemini: Case Studies and Common Techniques
Why is backward elimination looked down upon yet my team uses it and the model generates millions?
.
* Based on unique clicks.
** Please take a look at last week's issue #637 here.
Cutting Room Floor
Self-Optimizing Football Chatbot Guided by Domain Experts on Databricks
72M Points of Interest: Overture Map’s publishes a Places dataset
Build TikTok’s Personalized Real-Time Recommendation System in Python with Hopsworks
.
Whenever you're ready, 2 ways we can help:
Looking to get a job? Check out our “Get A Data Science Job” Course
It is a comprehensive course that teaches you everything you need to know about getting a data science job, based on answers to thousands of reader emails like yours. The course has three sections: Section 1 covers how to get started, Section 2 covers how to assemble a portfolio to showcase your experience (even if you don’t have any), and Section 3 covers how to write your resume.Promote yourself/organization to ~68,750 subscribers by sponsoring this newsletter. 30-35% weekly open rate.
Thank you for joining us this week! :)
Stay Data Science-y!
All our best,
Hannah & Sebastian
Invite your friends and earn rewards
![]()
![]()
Комментариев нет:
Отправить комментарий
Примечание. Отправлять комментарии могут только участники этого блога.