Data Science Weekly - Issue 627Curated news, articles and jobs related to Data Science, AI, & Machine Learning
Issue #627 |

|
.
Last Week’s Poll:
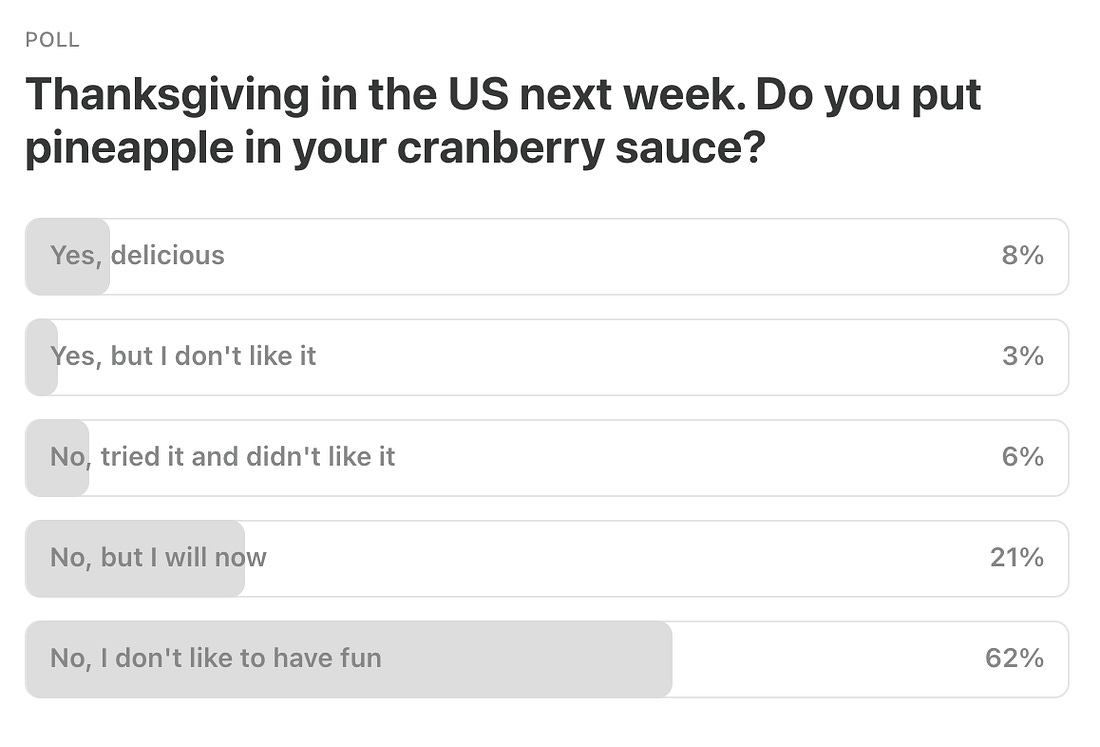 |
.
Data Science Articles & Videos
OpenLineage: An open framework for data lineage collection and analysis
Data lineage is the foundation for a new generation of powerful, context-aware data tools and best practices. OpenLineage enables consistent collection of lineage metadata, creating a deeper understanding of how data is produced and used…spurious correlations - correlation is not causation
Spurious correlations is a project that is fun first, and mildly educational second…It’s great to occasionally break all the rules just to see what happens! You shouldn’t take this project as a warning against believing research. You also shouldn’t take it as an affront on correlations or p-values. These are useful tools when used correctly…
It’s The End Of Observability As We Know It (And I Feel Fine)
In a really broad sense, the history of observability tools over the past couple of decades have been about a pretty simple concept: how do we make terabytes of heterogeneous telemetry data comprehensible to human beings? We’ve seen different companies tackle this in different ways for technology like Ruby on Rails, AWS, Kubernetes, and now OpenTelemetry…We build tools like dashboards, adaptive alerting, and dynamic sampling. All of these help us compress the sheer amount of stuff happening into something that’s comprehensible to our human intelligence. In AI, I see the death of this paradigm. It’s already real, it’s already here, and it’s going to fundamentally change the way we approach systems design and operation in the future…Learning Deep Representations of Data Distributions
A modern fully open-source textbook exploring why and how deep neural networks learn compact and information-dense representations of high-dimensional real-world data…A graph is worth 1000 tables
There are two common reasons police departments want to examine crime trends. One is to identify if crime is spiking, e.g. this week had 5 robberies, is that normal?…The second reason is to identify longer term trends…Well executed charts can identify between these two specific scenarios in ways that a table of two numbers cannot. Here I will show a few of my favorite examples, using robberies from Chicago as an example…Data Quality at Scale: Why Your Pipeline Needs More Than Green Checkmarks
I once watched a company make a major strategic decision based on a dashboard that had been showing incorrect data for three weeks…Nobody knew. The data pipeline ran successfully every day. All green checkmarks in Airflow. Zero alerts. Everything looked fine….Except the data was wrong…After years of building data platforms, I’ve learned something important: moving data is the easy part. Making sure it’s correct is what keeps you up at night. In this article, I’ll share what I’ve learned about data quality at scale…Building a Durable Execution Engine With SQLite
Lately, there has been a lot of excitement around Durable Execution (DE) engines. The basic idea of DE is to take (potentially long-running) multi-step workflows, such as processing a purchase order or a user sign-up, and make their individual steps persistent. If a flow gets interrupted while running, for instance due to a machine failure, the DE engine can resume it from the last successfully executed step and drive it to completion…From BI to AI: A Modern Lakehouse Stack with Lance and Iceberg
The modern, composable data stack has evolved around the idea of the lakehouse — a unified system that blends the flexibility of data lakes (i.e., object stores designed to hold data in open file formats) with the analytical performance and reliability of data warehouses. Projects like Apache Iceberg have been pivotal in making this vision a reality, offering transactional guarantees and schema evolution at scale…The goal of this post is to explain where Iceberg and Lance fit in the modern lakehouse stack, while discussing some of their key differences. We’ll highlight emerging data architectures that are bridging the worlds of analytics and AI/ML workloads using these two formats, all built on the same data foundation…Random points on the globe revisited
This holiday season I had reason to revisit a post from November 2021 about generating evenly distributed random points on the globe…For whatever reason, there doesn’t seem to be a widely used spatial point process model with this property, but there are low discrepancy sequences most often used for balanced sampling in operations like Monte Carlo simulation that can generate evenly spaced spatial patterns in two dimensions. In this post, I look at a couple of these along with some other alternatives, in the context set by my earlier post of generating random point patterns of even intensity on the globe…
KRaft: The Kafka Raft
Since KRaft introduction in 2021 with Kafka version 2.8.0, I have read many titles celebrating it. But I never really took the time to understand what it is and why they actually replaced Zookeeper. Maybe, as a data engineer, you wanted to raise this in your company with your manager, product owner, or wider engineering, but as if I could hear them saying: If you have a well-running Kafka cluster with company data, why would you risk it to change it…recently I saw that in the Kafka version 4.0 released in 2025 was the support for Zookeeper completely dropped. KRaft has become the only metadata mode, I thought: OK, maybe now is the time to understand what KRaft is. Let’s learn and write about it. So I decided to dig into it and write this article to share my findings…Engineering Growth: The Data Layers Powering Modern GTM
This article examines the GTM stack through the lens of data provenance, exploring not only what data powers modern go-to-market strategies but also how to engineer systems that integrate these five data sources responsibly and effectively…The modern GTM stack draws from five distinct data sources, each with unique engineering challenges, governance requirements, and strategic value:
Zero-party data: What customers intentionally share through preferences and explicit consent
First-party data: What you observe through behavioral tracking and product interactions
Second-party data: What partners share through privacy-preserving collaboration
Third-party data: What vendors sell through aggregated external sources
Fourth-party data: What emerges from multi-company consortium networks
How do you actually build intuition for choosing hyperparameters for xgboost? [Reddit]
I’m working on a model at my job and I keep getting stuck on choosing the right hyperparameters. I’m running a kind of grid search with Bayesian optimization, but I don’t feel like I’m actually learning why the “best” hyperparameters end up being the best. Is there a way to build intuition for picking hyperparameters instead of just guessing and letting the search pick for me?…Creating a Bespoke Data Diode for Air Gapped Networks
Air-gapped networks are physically isolated computer networks that do not connect to the internet or other external networks. They are widely used in industries where security is critical, such as finance, healthcare, and critical infrastructure. By design, these networks prevent remote access and reduce the risk of cyber attacks. However, while air gaps protect sensitive systems, they also create a challenge: how do you safely extract operational data for monitoring or analysis without compromising security? We were approached by a client with precisely this challenge…
.
Last Week's Newsletter's 3 Most Clicked Links
.
* Based on unique clicks.
** Please take a look at last week's issue #626 here.
Cutting Room Floor
Non-linear regression modelling for medical professionals; making curved paths straightforward
tinyplot - A lightweight extension of the base R graphics system
.
Whenever you're ready, 2 ways we can help:
Looking to get a job? Check out our “Get A Data Science Job” Course
It is a comprehensive course that teaches you everything you need to know about getting a data science job, based on answers to thousands of reader emails like yours. The course has three sections: Section 1 covers how to get started, Section 2 covers how to assemble a portfolio to showcase your experience (even if you don’t have any), and Section 3 covers how to write your resume.Promote yourself/organization to ~68,750 subscribers by sponsoring this newsletter. 30-35% weekly open rate.
Thank you for joining us this week! :)
Stay Data Science-y!
All our best,
Hannah & Sebastian
You're currently a free subscriber to Data Science Weekly Newsletter. For the full experience, upgrade your subscription.
![]()
![]()
Комментариев нет:
Отправить комментарий
Примечание. Отправлять комментарии могут только участники этого блога.